![]()
mascarade package implements a procedure to automatically generate 2D
masks for clusters on single-cell dimensional reduction plots like t-SNE
or UMAP.
See the tutorial for usage details and gallery for examples on different datasets.
The package can be installed from GitHub:
remotes::install_github("alserglab/mascarade")Loading necessary libraries:
library(mascarade)
library(ggplot2)
library(data.table)
library(Seurat)
Loading get the example PBMC3K dataset:
pbmc3k <- readRDS(url("https://alserglab.wustl.edu/files/mascarade/examples/pbmc3k_seurat5.rds"))
pbmc3k <- NormalizeData(pbmc3k)
pbmc3k
## An object of class Seurat
## 13714 features across 2638 samples within 1 assay
## Active assay: RNA (13714 features, 2000 variable features)
## 2 layers present: counts, data
## 2 dimensional reductions calculated: pca, umap
Generating masks:
maskTable <- generateMaskSeurat(pbmc3k)DimPlot with the mask and labels:
DimPlot(pbmc3k) + NoLegend() +
    fancyMask(maskTable, ratio=1)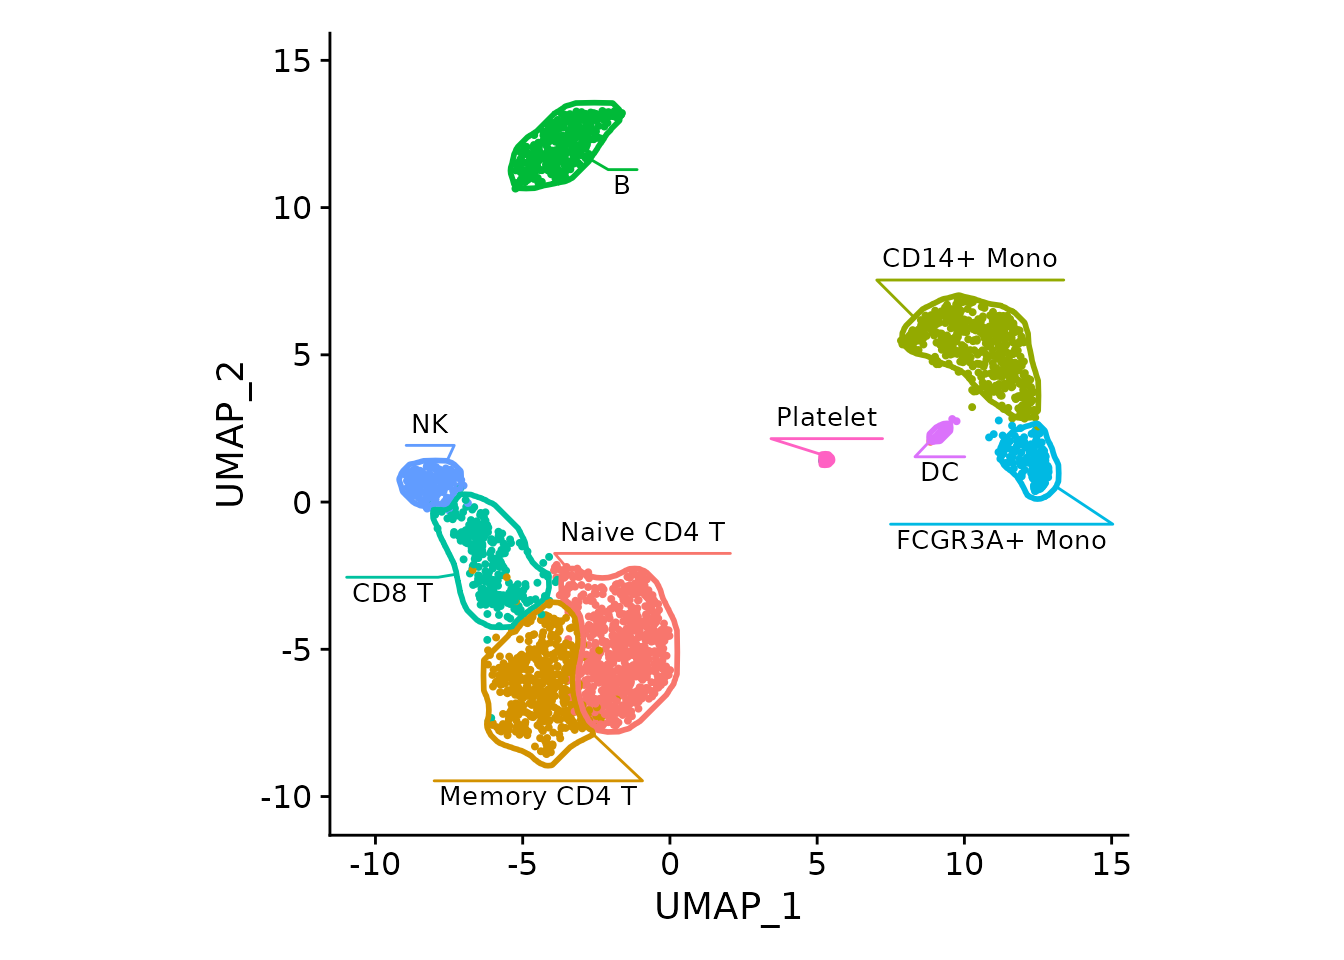
DimPlot with the just the labels
DimPlot(pbmc3k) + NoLegend() +
    fancyMask(maskTable, linewidth=0, ratio=1)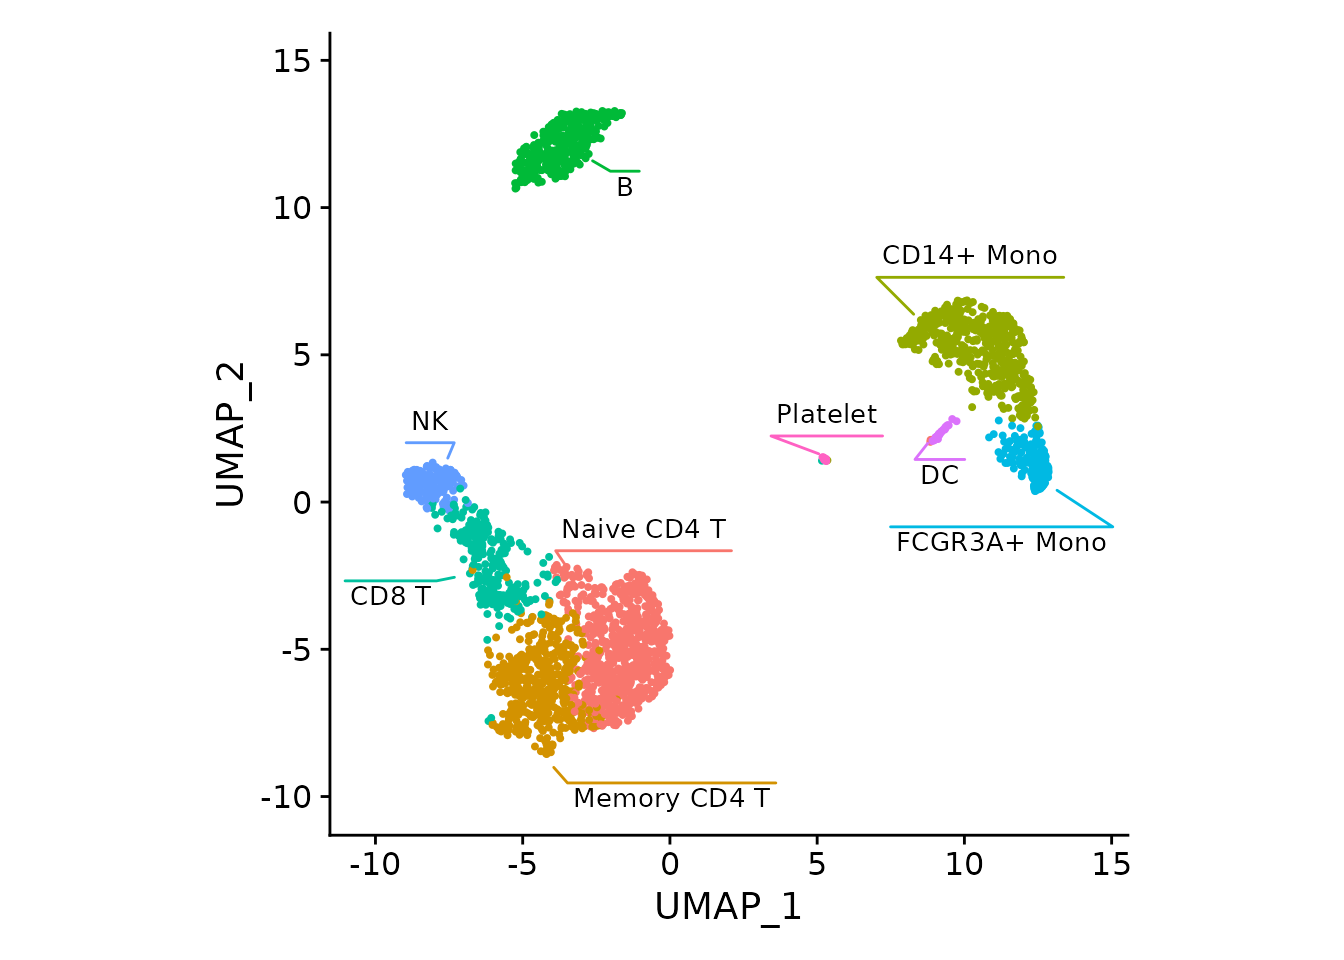
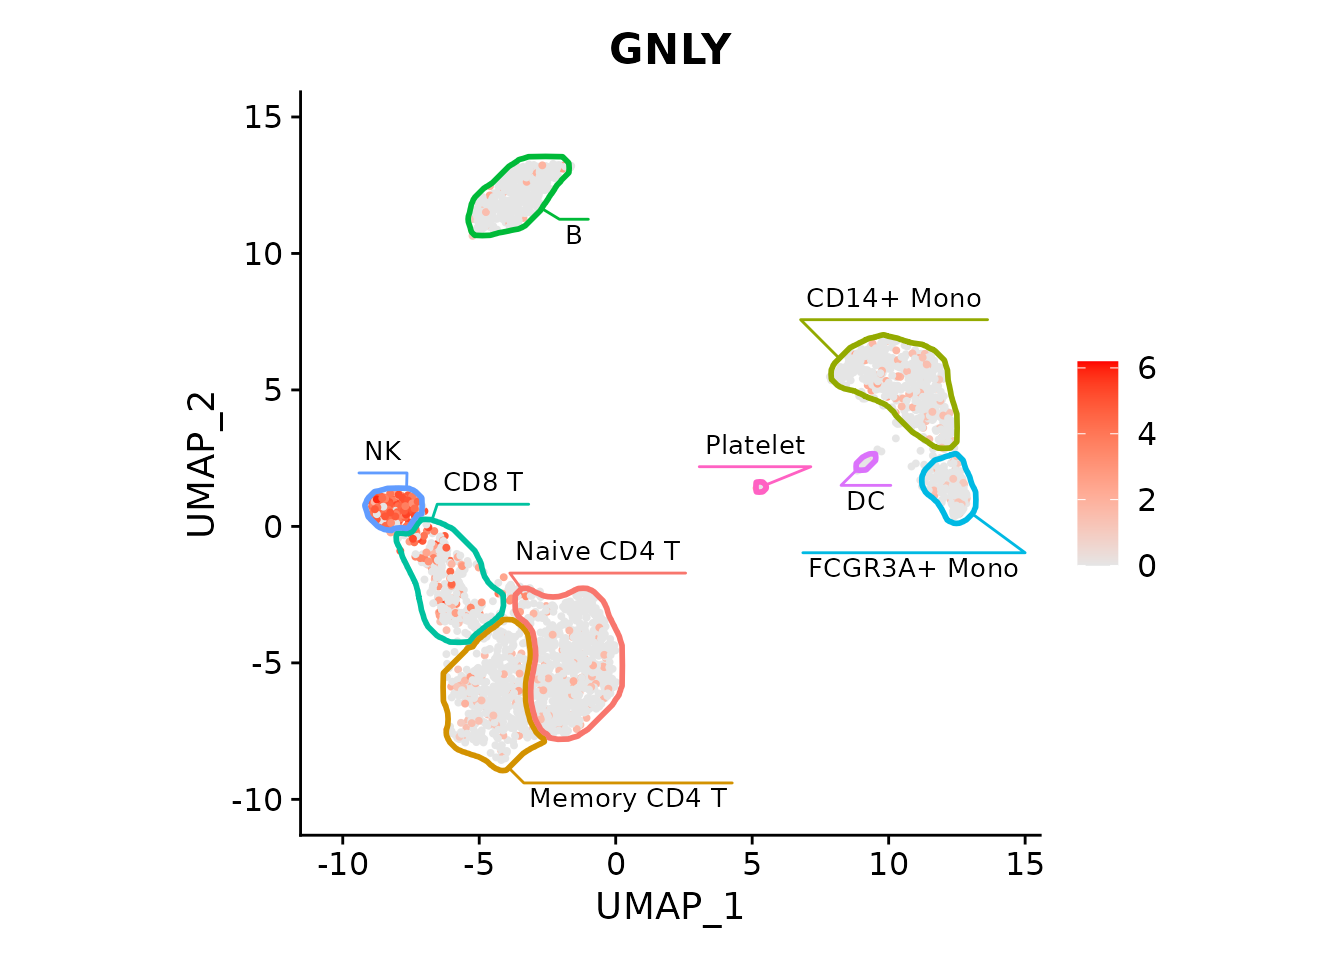
FeaturePlot with the mask and labels showing GNLY gene being specific
to NK cells:
FeaturePlot(pbmc3k, "GNLY", cols=c("grey90", "red")) +
    fancyMask(maskTable, ratio=1)